

Management Analysis Of Financial Position, Operating Results, And Cash Flows
OPERATING RESULTS
① Overall business conditions
In 2025, the world continued to undergo rapid and drastic changes, significantly impacting the business environment surrounding the Group. In addition to subdued consumer sentiment globally, heightened health consciousness intensified regulatory measures to curtail alcohol and sugar consumption, further exacerbating business conditions. Advances in AI rapidly transformed people’s values and lifestyles, while climate change, regional conflicts, and economic instability stemming from change of government in the United States and other factors required management to accurately identify and respond to these environmental changes.
In these circumstances, the Group has consistently placed CSV at the core of its management, aiming for long-term and sustainable growth. At the same time, to respond swiftly and flexibly to environmental changes, we transitioned to a new management cycle to annually review our three-year plan in 2025.
Furthermore, alongside our alcoholic beverages, non-alcoholic beverages, and pharmaceuticals businesses, we have aimed to position our Health Science business, which views solving health issues as a business opportunity, as the Group's growth driver. In 2025, profitability improved following the completion of the acquisition of 100% ownership of FANCL Corporation and the sale of the amino acid business and so forth of Kyowa Hakko Bio Co., Ltd. This established a solid business foundation for the growth of our Health Science business. Our existing alcoholic beverages, non-alcoholic beverages, and pharmaceutical businesses also performed steadily, delivering results exceeding our plan. Consequently, consolidated normalized operating profit reached a record high for the third consecutive year.
Our ESG initiatives also received high recognition from external organizations. In the MSCI ESG Rating* , an ESG indicator, we achieved an “AA” rating for the fifth consecutive year, placing us alongside global leaders in CSV management.
Furthermore, in the 7th Nikkei SDGs Management Survey, the Company secured the highest position in the overall “SDGs Management” ranking for the seventh consecutive year, receiving the top “Grand Prize” awarded to only one company.
-
*A rating system developed by Morgan Stanley Capital International (MSCI) in the United States, measuring resilience to environmental, social, and governance risks and assigning ratings from AAA to CCC.
Lion Pty Ltd has been certified as a B Corp, joining the ranks of companies meeting high standards in social and environmental performance, accountability, and transparency. A North American company New Belgium Brewing Company, Inc. and an Australian company Blackmores Limited are also certified, demonstrating the high regard for the initiatives undertaken by the Group’s major overseas operating companies.
(¥ billions, unless otherwise stated)
| FY2025 | FY2024 | Change | ||
|---|---|---|---|---|
| Consolidated revenue | 2,433.4 | 2,338.4 | 95.0 | 4.1% |
| Consolidated normalized operating profit | 251.8 | 211.0 | 40.8 | 19.3% |
| Consolidated operating profit | 209.7 | 125.3 | 84.3 | 67.3% |
| Consolidated profit before tax | 237.9 | 139.7 | 98.1 | 70.2% |
| Profit attributable to owners of the Company | 147.5 | 58.2 | 89.3 | 153.4% |
(Key performance indicators)
| FY2025 | FY2024 | Change | ||
|---|---|---|---|---|
| ROIC | 7.6% | 4.1% | ― | ― |
| EPS (yen) | 182 | 72 | 110 | 153.4% |
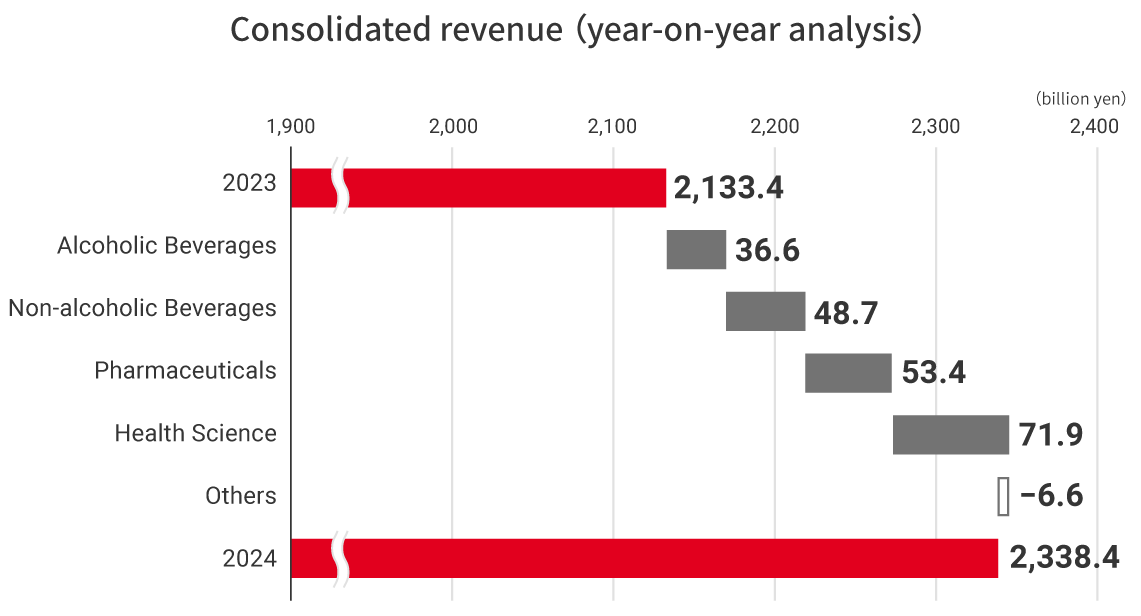
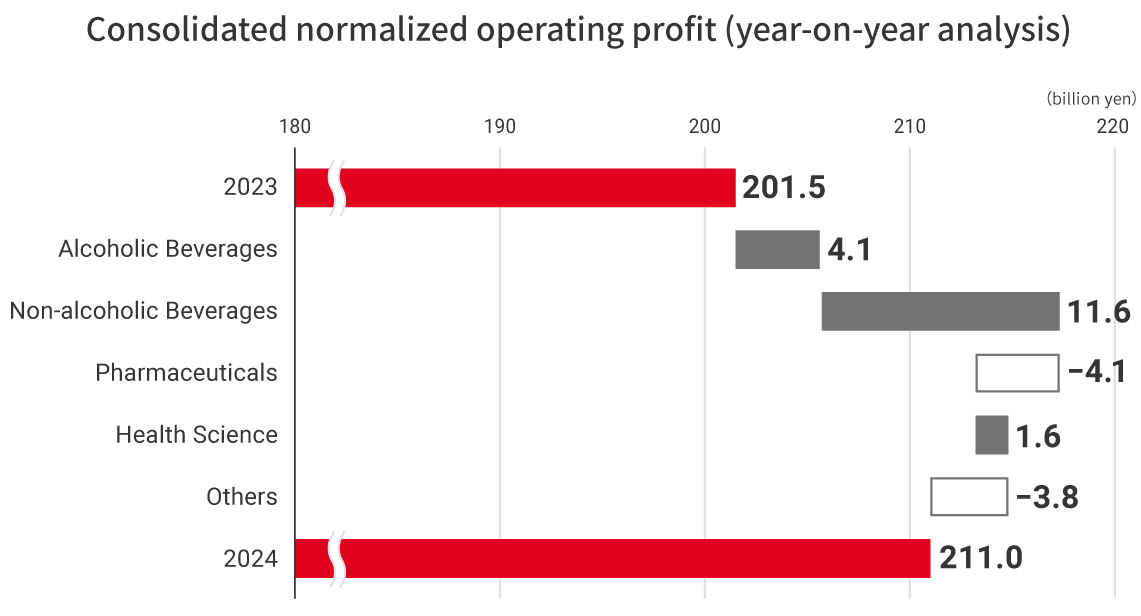
Consolidated revenue for fiscal year 2025 increased due to steady progress in each business and the full-year contribution of FANCL CORPORATION, reaching a record high. Consolidated normalized operating profit increased significantly and reached a record high, driven by steady progress in each business including the Alcoholic Beverages businesses in Japan and Australia, the full-year contribution of FANCL CORPORATION, and improved profitability of the Health Science business including the early realization of structural reforms at Kyowa Hakko Bio Co., Ltd. In addition, profit attributable to owners of the Company increased significantly by more than 2.5 times year on year due to an increase in normalized operating profit, and other factors.
Among the key performance indicators, ROIC was 7.6%, achieving the initial target due to an increase in profit. EPS increased significantly along with the increase in profit attributable to owners of the Company, and increased by 110 yen from the previous fiscal year to 182 yen.
② Performance by reportable segment
Results by segment are as follows.
(¥ billions, unless otherwise stated)
| FY2025 | FY2024 | Change | ||
|---|---|---|---|---|
| Consolidated revenue | 2,433.4 | 2,338.4 | 95.0 | 4.1% |
| Alcoholic Beverages | 1,075.3 | 1,081.7 | (6.4) | (0.6)% |
| Non-alcoholic Beverages | 578.2 | 564.9 | 13.3 | 2.4% |
| Pharmaceuticals | 496.5 | 495.3 | 1.2 | 0.2% |
| Health Science | 251.4 | 175.3 | 76.1 | 43.4% |
| Others | 32.0 | 21.3 | 10.8 | 50.6% |
| Consolidated normalized operating profit | 251.8 | 211.0 | 40.8 | 19.3% |
| Alcoholic Beverages | 135.4 | 124.0 | 11.3 | 9.1% |
| Non-alcoholic Beverages | 67.7 | 64.0 | 3.7 | 5.8% |
| Pharmaceuticals | 102.3 | 91.9 | 10.5 | 11.4% |
| Health Science | 11.1 | (10.9) | 22.0 | ― |
| Others | (64.7) | (58.0) | (6.7) | ― |
FINANCIAL POSITION
① General overview
Total assets at the end of fiscal year 2025 were ¥3,494.0 billion, an increase of ¥139.9 billion from the end of the previous fiscal year. Property, plant and equipment, goodwill and intangible assets increased by ¥131.9 billion in total from the end of the previous fiscal year, mainly due to an increase in intangible assets associated with the in-licensing of development products at Kyowa Kirin Co., Ltd. and an increase in property, plant and equipment associated with the progress of plant construction.
Equity increased by ¥61.4 billion from the end of the previous fiscal year to ¥1,595.1 billion due to an increase in retained earnings of ¥70.2 billion, an increase in reserves of ¥44.4 billion, and a decrease in non-controlling interests of ¥44.0 billion. The increase in reserves was mainly attributable to an increase in foreign currency translation differences on foreign operations of ¥41.5 billion due to a weak yen. The decrease in non-controlling interests was mainly attributable to the impact of the additional acquisition of FANCL Corporation.
Liabilities increased by ¥78.5 billion from the end of the previous fiscal year to ¥1,898.9 billion. Bonds and borrowings increased by ¥65.9 billion mainly due to new issuances of bonds.
As a result, the equity ratio attributable to owners of the Company and the gross debt equity ratio stood at 36.8% and 0.72 times, respectively.
② Financial status of reportable segments
Alcoholic Beverages Business
Segment assets of the Alcoholic Beverages Business at the end of fiscal year 2025 increased by ¥66.0 billion to ¥1,433.5 billion from the end of the previous fiscal year mainly due to an increase in property, plant and equipment as a result of capital expenditures.
Non-alcoholic Beverages Business
Segment assets of the Non-alcoholic Beverages Business at the end of fiscal year 2025 increased by ¥38.4 billion to ¥364.7 billion from the end of the previous fiscal year mainly due to an increase in property, plant and equipment as a result of capital expenditures.
Pharmaceuticals Business
Segment assets of the Pharmaceuticals Business at the end of fiscal year 2025 increased by ¥43.9 billion to ¥1,056.6 billion from the end of the previous fiscal year mainly due to an increase in marketing rights and trade receivables.
Health Science Business
Segment assets of the Health Science Business at the end of fiscal year 2025 remained at the same level as the end of the previous fiscal year at ¥764.1 billion mainly due to an increase in short-term loans receivable despite a decrease in inventories.
CASH FLOWS
① Cash flows and liquidity status
The balance of cash and cash equivalents (hereinafter, “net cash”) at the end of fiscal year 2025 was ¥125.3 billion, an increase of ¥17.4 billion (excluding a decrease of ¥10.7 billion due to changes in accounting policy) from the end of the previous fiscal year. Cash flows for each activity were as follows:
Cash flows from operating activities
Net cash provided by operating activities increased by ¥52.6 billion year on year to ¥295.4 billion. Despite decreases in non-cash items, namely a ¥18.3 billion decrease from the absence of a loss on step acquisition and a ¥19.3 billion decrease from the absence of an impairment loss on equity-accounted investments recorded in the previous fiscal year, as well as a ¥12.3 billion increase in outflow of working capital, a ¥98.1 billion increase in profit before tax year on year to ¥237.9 billion, resulted in an increase of ¥38.4 billion in the sub-total. Below the sub-total line, cash flows from operating activities increased year on year due to factors such as a ¥17.8 billion decrease in income taxes paid.
Cash flows from investing activities
Net cash used in investing activities decreased by ¥144.4 billion year on year to ¥185.0 billion. The main factor for the decrease was expenditure for the acquisition of shares of subsidiaries, which decreased by ¥144.9 billion year on year to ¥14.9 billion due to a reactionary decrease from consolidating Orchard Therapeutics Limited and FANCL Corporation as subsidiaries in the previous fiscal year. Net cash provided by investing activities for fiscal year 2025 included ¥8.1 billion in proceeds from sale of property, plant and equipment and intangible assets, and ¥0.6 billion in proceeds from sale of investments through our continuous efforts to reduce cross-shareholdings. In addition, expenditures for the acquisition of property, plant and equipment and intangible assets decreased by ¥5.0 billion year on year to ¥175.6 billion, and proceeds from sale of equityaccounted investments decreased by ¥2.9 billion year on year to ¥0.6 billion.
Cash flows from financing activities
Net cash used in financing activities was ¥110.5 billion (net cash provided by financing activities was ¥58.1 billion in the same period of the previous fiscal year). This was mainly due to proceeds from the issuance of bonds amounted to ¥100.0 billion, proceeds from long-term borrowings decreased by ¥268.9 billion year on year to ¥28.0 billion, repayments of bonds increased by ¥5.0 billion year on year to ¥35.0 billion, and repayments of long-term borrowings decreased by ¥48.4 billion year on year to ¥30.0 billion. In the current fiscal year, due to the additional acquisition of shares of FANCL Corporation, a consolidated subsidiary, payments for acquisition of non-controlling interests amounted to ¥81.8 billion. In addition, the Company has been paying dividends targeting a consolidated dividend on equity (DOE) of 5% or more since this fiscal year, and dividends paid, including non-controlling interests, amounted to ¥73.5 billion.
The Group, with due consideration to its cost of capital, will continue its dividend policy of targeting a DOE of 5% or more and, in principle, adopting a progressive dividend approach in order to achieve more stable and sustainable dividends. We place top priority on stable dividends, and consider investments and shareholder returns in accordance with cash balance while repaying interest-bearing debt and investing in intangible assets for future growth.
② Basic capital policy
The Company will allocate resources to its businesses and distribute profits to its shareholders as set out below.
Regarding resource allocation to businesses, giving top priority to growth investment with a focus on the Health Science domain, the Company will make investments that contribute to enhancement of existing businesses and profitability improvement. The Company will also implement a stable and continuous allocation of resources to intangible value (such as brands, research and development, information and communication technology (ICT), and human resources) as well as new business creation that sustain the growth of future cash flows. The Company will take a disciplined approach to investments in terms of maintaining and improving the Kirin Group’s capital efficiency.
We view the distribution of profits to shareholders as a key management matter. Since our listing in 1949, we have continued to pay dividends without fail in every fiscal year. We paid dividends until FY2024 with a target payout ratio of 40% or more on a normalized EPS basis. From FY2025 onwards, in order to achieve more stable and sustainable dividends, we have changed our dividend policy to one that aims for a consolidated dividend on equity (DOE) of 5% or more. In principle, we will pay a progressive dividend per share. As part of management that is conscious of capital costs with the aim of increasing corporate value, we will strive to further enhance the return of profits to shareholders and improve capital efficiency. We will continue to consider whether or not to repurchase our own shares as an additional form of shareholder return, taking into account the optimal capital structure, the market environment, and our capital capacity after the investment.
With regard to financing, we will utilize sustainable finance to promote CSV management. Funds raised will be allocated to initiatives aimed at solving social issues in line with the CSV Purpose. In preparation for rapid changes in the economic environment and other factors, priority is given to debt financing while maintaining a high credit rating that is not affected by financial conditions. When raising funds through the issuance of shares for investments required to achieve medium- to long-term goals, we will fulfill our accountability to shareholders by carefully considering the impact on stakeholders and other factors, after verification and review by the Board.