[Alcoholic beverages]
Kirin Beer University Report
Global Beer Consumption by Country in 2018
Global beer consumption increased for the first time in four years; Asia remains the top beer-consuming region for the 11th consecutive year
- Other
December 24, 2019
Kirin Holdings Company, Limited
Kirin Holdings Company, Limited (President and CEO: Yoshinori Isozaki; hereafter “Kirin”) operates the Kirin Beer University (https://www.kirin.co.jp/entertainment/daigaku/), a virtual university on the Internet which was established in July 2001 to promote the enjoyment of beer and deep knowledge about beer to consumers. With various faculties and facilities, consumers can learn about a variety of topics, ranging from the best way to drink delicious beer to other interesting facts about beer—24 hours a day, 365 days a year.
This report for 2018 publishes the details of global beer consumption in 170 major countries and regions. The report is based on findings obtained from questionnaires sent by Kirin to various brewers’ associations around the world, as well as the latest industry statistics available overseas. The data for global beer consumption has been tracked by Kirin since 1975.
Main Topics
- Global beer consumption stood at approximately 188.79 million kiloliters in 2018, up 0.8% from the previous year, the first time in four years. If the volume of the Tokyo Dome was compared to a beer mug, this level of consumption is equivalent to filling up the Tokyo Dome about 152 times over.
- China remained the largest beer-consuming country in the world for the 16th consecutive year; however, consumption decreased in 2018 by 2.0% year-on-year. Mexico, in fourth place, marked a 5.3% increase in beer consumption, maintaining growth for two years in a row. Besides Mexico, other countries among the world’s top 10 beer-consuming countries which saw an increase were Brazil, Germany, the United Kingdom, Vietnam, and Spain.
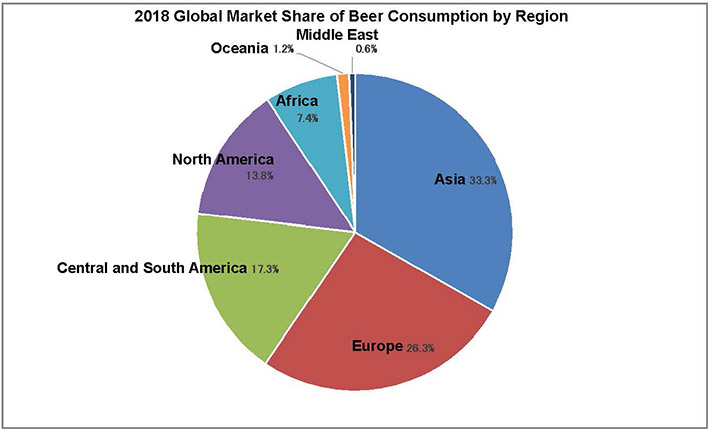
- By region, Asia consumed 0.1% less beer in 2018 compared to 2017, but still holds a 33.3% share of the global beer market, remaining the world’s largest beer-consuming region for the 11th consecutive year. Beer consumption in Africa went up 4.4% from the previous year, marking its eighth year of growth.
In 2018, the global beer consumption was 188.79 million kiloliters (equivalent to approximately 298.2 billion 633 ml bottles), with an increase of about 1,540,000 kiloliters, which is equivalent to approximately 2.4 billion 633 ml bottles. In comparison with 2017, there was an annual increase of 0.8%. The total volume of the global beer consumption is equivalent to about 152 Tokyo Domes, if the stadium was a beer mug with a capacity of about 1.24 million kiloliters.
1. Global Beer Consumption by Country in 2018 (Table 1)
- China remained the largest beer-consuming country in the world for the 16th consecutive year since 2003, despite a decrease of 2.0% compared to 2017
- Japan was ranked seventh for the 12th consecutive year since 2007, consuming 0.1% less beer than 2017.
2. Global Beer Consumption by Region in 2018 (Table 2)
- Although beer consumption decreased in the Asia and North America, other regions saw consumption increase.
- Asia remained the world’s largest beer-consuming region for the 11th consecutive year, despite a decrease of 0.1% compared to the previous year. Although annual consumption increased in Vietnam (+7.1%), India (+5.7%), Thailand (+1.6%), and the Philippines (+8.8%), the decrease in China (-2.0%) resulted in the overall decline.
- Beer consumption in Africa grew for the eighth consecutive year, with an annual increase of 4.4% in 2018.
3. Per-capita Beer Consumption by Country in 2018 (Table 3)
- Czech Republic remained the world’s top in per-capita beer consumption for the 26th consecutive year since 1993.
- Among the top 35 countries, 21 saw an increase in consumption from 2017 to 2018.
- Japan consumed 40.2 liters of beer—the equivalent of about 63.4 bottles (633 ml)—on a per-capita basis in 2018, up 0.1 bottle year-on-year.
The Kirin Group brings joy to society by crafting food and healthcare products inspired by the blessings of nature and the insights of our customers.
Note:
Consumption volume in Japan is a combination of beer, happo-shu (low-malt beer), and new genre (non-malt beer). Due to rounding, the figures may not necessarily add up.
Among the countries whose figures for the previous year were revised for this year’s report, the revised figures are used to calculate year-on-year changes.
* The volume of global consumption for the previous year has been updated (revised from 186.72 million kiloliters to 187.25 million kiloliters).
Source:
Questionnaires sent by Kirin to the brewers’ associations in major countries.
The Barth Report Hops 2018/2019(BARTH-HAAS GROUP)
Global Beverage Forecasts September 2019 (GlobalData Plc)
* As of 2013, there has been a change in the industry statistics data source. Therefore, some of the data may not necessarily correspond with past reports.
(Table 1) Global Beer Consumption by Country in 2018
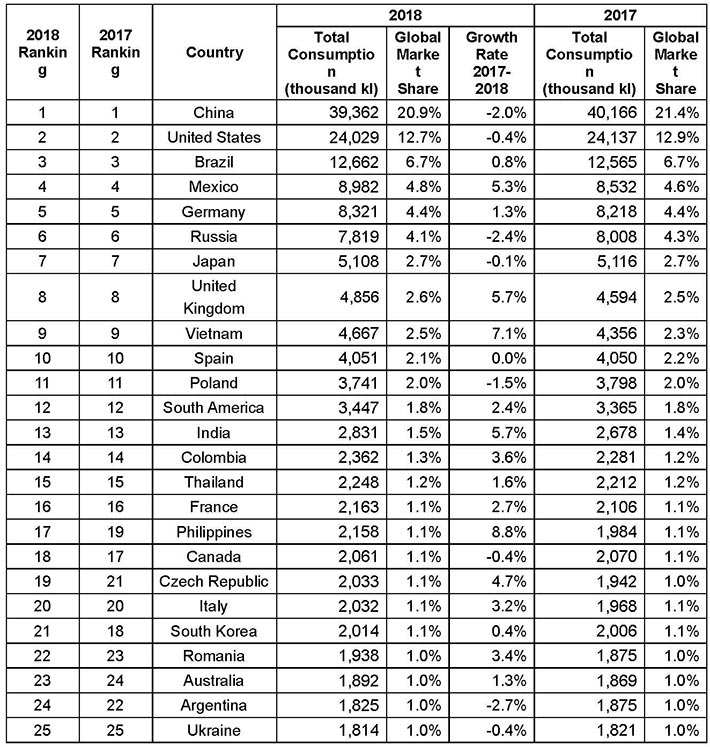
Comments
- Global beer consumption stood at approximately 188.79 million kiloliters in 2018, up 0.8% from the previous year, the first time in four years.
- Total beer consumption in China decreased by 2.0% year-on-year due to the maturing of consumer demand and saturation of the market. On the other hand, products in the mid to high price range have been strong due to increased individual spending arising from more wealthy people.
- In the United Kingdom, beer consumption increased significantly by 5.7% year-on-year due to the Soccer World Cup and good weather.
- In the Philippines, beer consumption increased by 8.8% year-on-year. Although the growth in individual spending slew down slightly due to a temporary acceleration of inflation from factors such as rice shortage arising from weather, consumption increased overall for the year with support from the generally favorable external environment such as a better income situation brought about by sustained economic growth.
(Table 2) Global Beer Consumption by Region in 2018
-
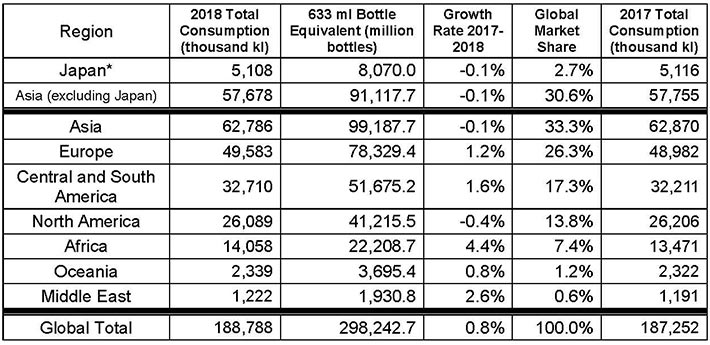
Note:Consumption volume in Japan is a combination of beer, happo-shu (low-malt beer), and new genre (non-malt beer).
Comments
- Annual beer consumption in Asia was the highest in the world for the 11th consecutive year, although there was a decrease of 0.1% from the previous year, with its global market share dropping to 33.3% from last year’s 33.6%.
- Asia remained the top beer-consuming region led by Vietnam, India, Thailand, and the Philippines, which saw year-on-year increases of 7.1%, 5.7%, 1.6%, and 8.8% respectively. However, consumption in China fell by 2.0% year-on-year, leading to an overall decrease in regional consumption for the fifth year in a row.
- Europe, ranking second, recorded an increase of 1.2% from the previous year due to increased consumption in Germany, the United Kingdom, and France of 1.3%, 5.7%, and 2.7% respectively.
- Central and South America, ranking third, recorded an increase of 1.6% from the previous year due to increased consumption in Brazil and Mexico of 0.8% and 5.3% respectively.
(Table 3) Per-capita Beer Consumption by Country in 2018
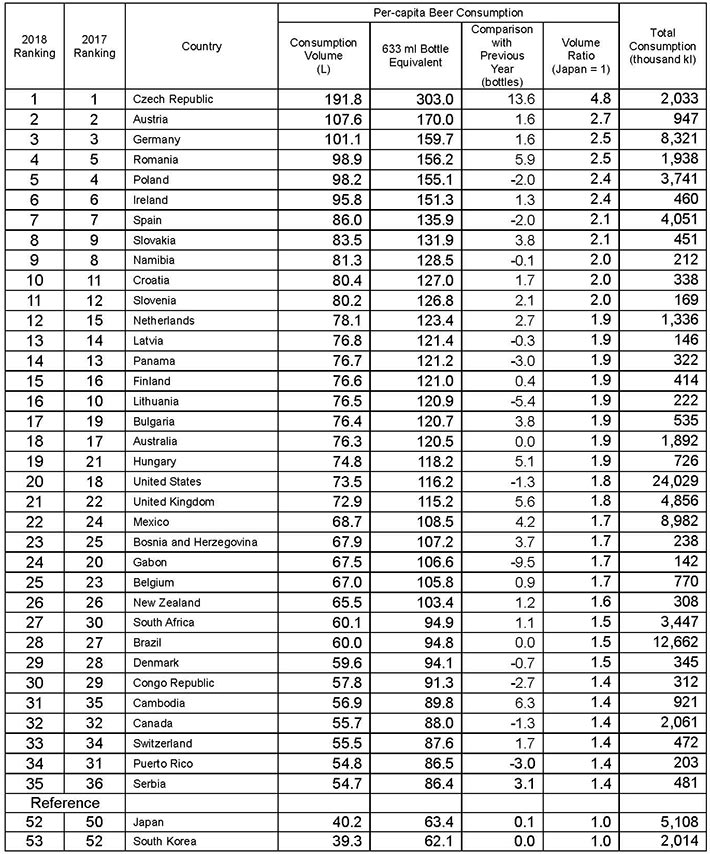
Comments
- Czech Republic led all other nations in per-capita beer consumption for the 26th consecutive year.
- Among the top 35 countries ranked by per-capita beer consumption, 21 increased consumption levels from 2017 to 2018.